- 23
- 27
- 20
- 16
- 26
- 4
Results Details
November 14, 2024 01:30 (2024-11-13 22:30 GMT) / 126663
Gosloto 5/36
Hot and Cold Numbers
View Hot, Cold and Overdue numbers for Gosloto 5/36 based on latest 4 weeks, 12 weeks, half a year, year to date or last 10 draws, last 30 draws, last 50 draws, last 100 draws.
You can also find detailed number statistcs in Russia Gosloto 5/36 Number Frequencies
Next Draw
Next draw date is: January 10, 2025 12:00 (2025-01-10 09:00 GMT). Follow our account in Twitter to be notified when fresh results and analysis are available. Use Gosloto 5/36 Numbers Generator to generate numbers for the next draw and test it using our Gosloto 5/36 Prediction System.
Results Checker
Check your lottery ticket with Gosloto 5/36 Results Checker or browse Gosloto 5/36 Recent Results.
Results Analysis
Click on the feature code to view feature chart.
| Code | Value | Predicted Correctly | Statistics after draw | Deviation | xSSD | Prediction for next draw | |
|---|---|---|---|---|---|---|---|
| MEAN | SSD | ||||||
| MEAN_M | 19.33 | 15.8527 | 3.6463 | 3.4807 | 1.0 | 15.9 ± 7.3 | |
| MED_M | 15.50 | 16.5095 | 2.4725 | 1.0095 | 0.4 | 16.5 ± 4.9 | |
| RNG_M | 23 | 28.6763 | 4.8158 | 5.6763 | 1.2 | 28.7 ± 9.6 | |
| SUM_M | 116 | 95.1161 | 21.8776 | 20.8839 | 1.0 | 95.1 ± 43.8 | |
| MINGAP_M | 1 | 1.3405 | 0.9276 | 0.3405 | 0.4 | 1.3 ± 1.9 | |
| MAXGAP_M | 12 | 12.9385 | 4.0634 | 0.9385 | 0.2 | 12.9 ± 8.1 | |
| SUM_A | 116 | 95.1161 | 21.8776 | 20.8839 | 1.0 | 95.1 ± 43.8 | |
Check out detailed Gosloto 5/36 Predictions page
Analysis Explanation
After each draw we calculate values for a number of features we analyze for the game. Each feature is a random value itself and we calculate statistics for them. We calculate expected value (MEAN) and sample standard deviation (SSD). more info
Also for each value we present how current result is correlate with feature statistics. Deviation is the absolute value of the result and mean difference. xSSD is deviation to SSD ratio.
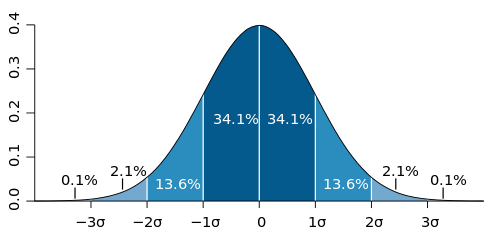
xSSD shows to what area of bell shaped curve the result belongs. Assuming that each feature is distributed under normal distribution law the following is true: 68% of results lies within MEAN±SSD interval, 95% – MEAN±2*SSD and 99.7% of all results within MEAN±3*SSD (see illustration below):
Feature codes are as following: